The Truth About Rental Income Calculators
What They Don’t Tell You About Real Revenue
Why those “easy money” projections are setting up property owners for disappointment
The Calculator Fantasy
You know those sleek online rental income calculators promising you’ll earn “$12,000 per month” from your beach house? Just plug in your address, hit enter, and watch the dollar signs dance across your screen.
The appeal is undeniable. In 30 seconds, you can see your property’s “earning potential” and start planning how to spend that projected $150,000 annual income.
But here’s the problem: the number that comes out is not going to be accurate.
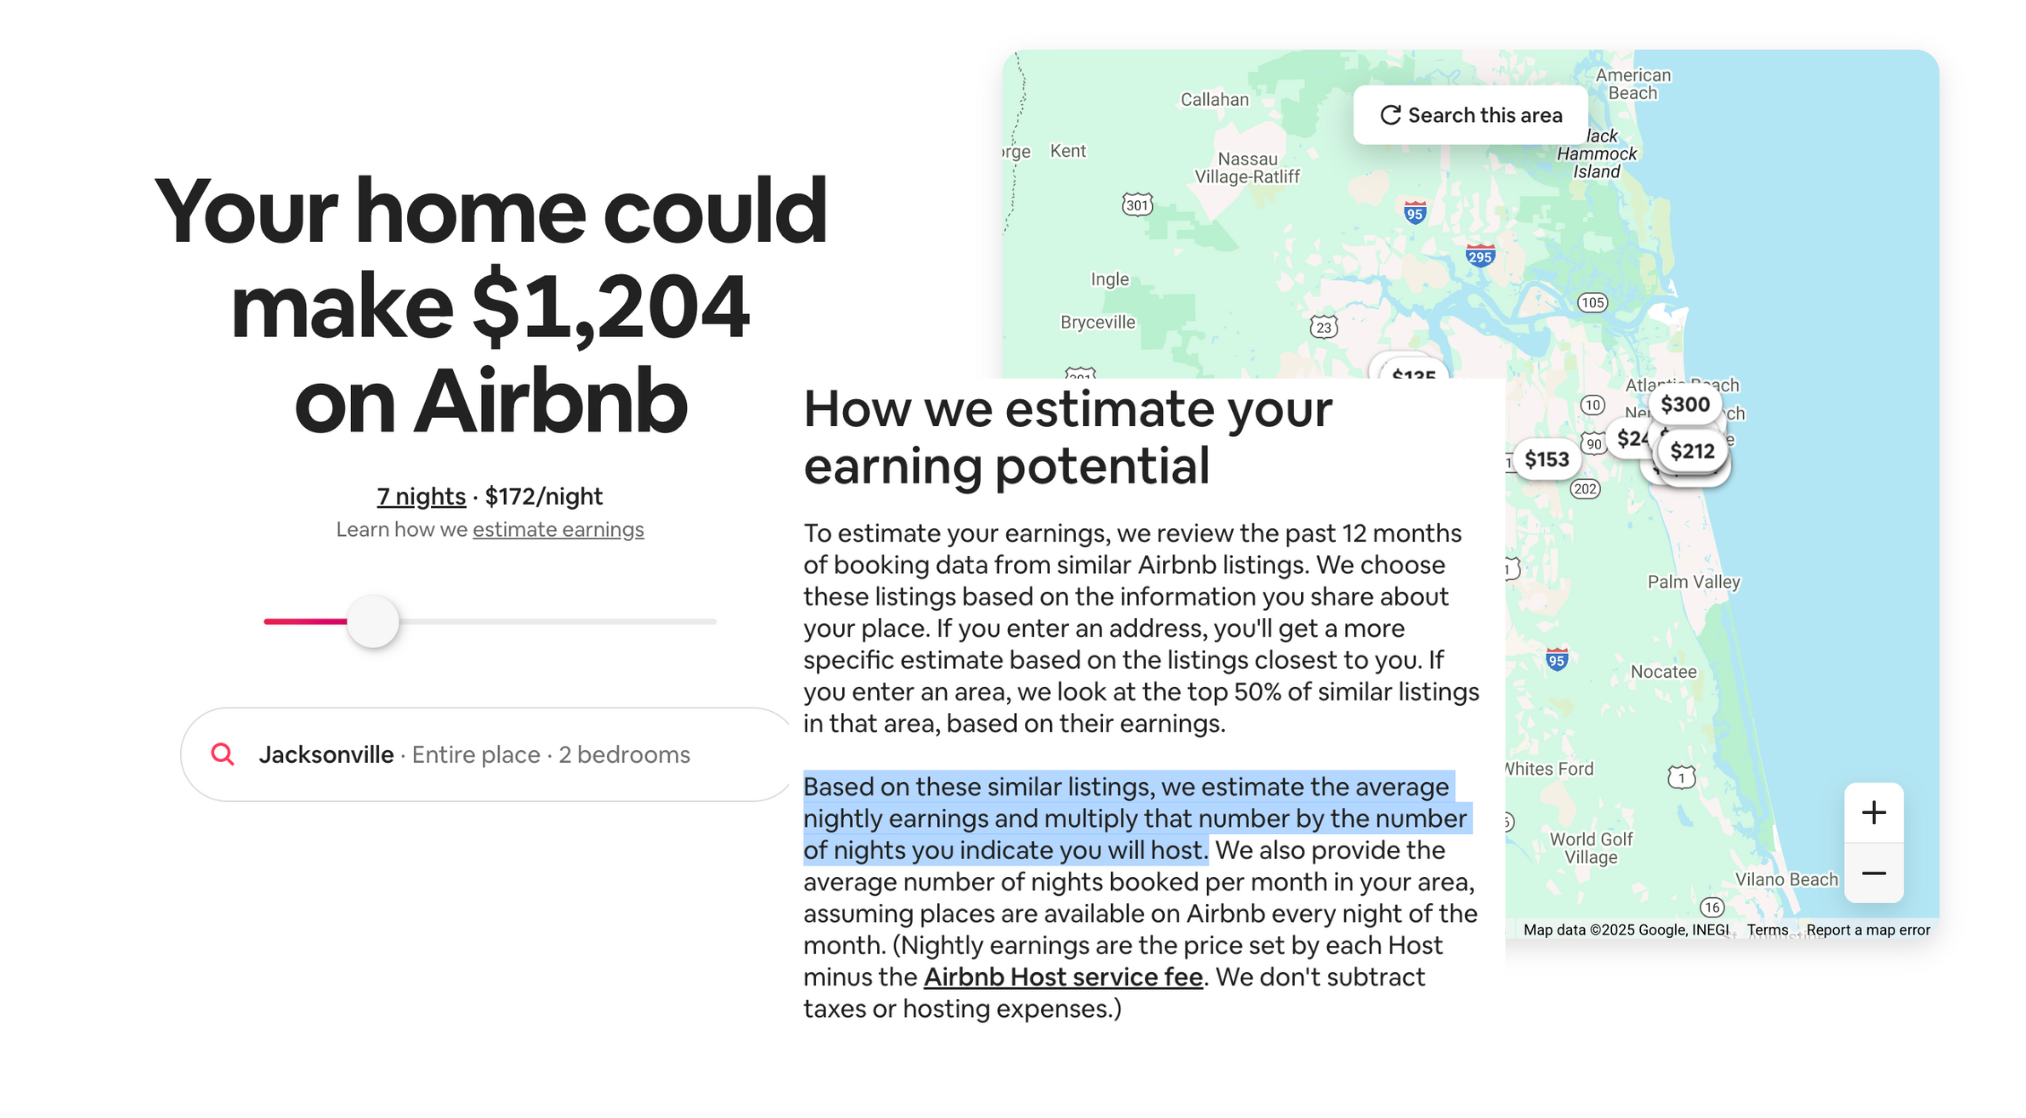
Calculator.net warns their results are “very unlikely” to match reality. Even Airbnb’s own calculator relies on self-reported data from hosts and only uses the “top 50% of similar listings” while excluding taxes and hosting expenses from their projections. Zillow’s rental calculator assumes properties will achieve national average appreciation rates of 3.5-3.8% annually, regardless of local market conditions or economic cycles.Yet millions of property owners still base investment decisions on these digital fortune tellers.
The result? A lot of disappointed investors wondering where their projected income went.
What Rental Income Calculators Get Wrong
The Big Three Myths
The Big Three Myths
1. The Occupancy Fairytale
Calculators Say: 75% occupancy all year
Reality: Most properties hit 45-65%, even good ones rarely exceed 75%
Calculators assume your property will be booked three-quarters of the year. According to AirDNA’s latest data, the national average is actually 56%. That’s a pretty big difference when you’re calculating annual income.
Even in prime markets like Northeast Florida, achieving 75%+ occupancy requires:
- Professional marketing across multiple channels
- Dynamic pricing that responds to market conditions
- Exceptional guest experiences that generate repeat bookings
- Strategic calendar management and booking policies
2. The “Easy Money” Myth
Calculators Say: Minimal effort required
Reality: 400+ hours annually of your life
HomeAway found that self-managed owners spend 8+ hours per week on their properties. That’s more than a part-time job. Calculators somehow forget to mention you’ve just become a:
- Customer service representative
- Maintenance coordinator
- Marketing manager
- Housekeeping supervisor
- Financial analyst
3. The Magic Money Math
Calculators Say: Peak rates year-round
Reality: Your $800 summer nights become $400 winter nights
Those calculators love using your best possible rate as the baseline. But unless you’re in Hawaii, you’ve got seasons where rates fluctuate dramatically based on:
- Weather and climate patterns
- Local event calendars
- School schedules and holidays
- Regional travel preferences


The Hidden Costs Calculators Ignore
Even if calculators got the revenue right, they completely ignore the costs:
Operational Expenses
- Cleaning: $75-150 per turnover
- Linens and Supplies: $2,000-5,000 annually
- Maintenance: $8,000-15,000 annually
- Insurance: $3,000-8,000 annually
- Utilities: $3,000-6,000 annually
Marketing and Booking Costs
- Platform Fees: 3-15% of gross revenue
- Photography: $500-2,000 annually
- Marketing: $1,000-3,000 annually
Time Investment
- Self-Management: 400+ hours annually
- Opportunity Cost: What else could you do with that time?
The Reality Check
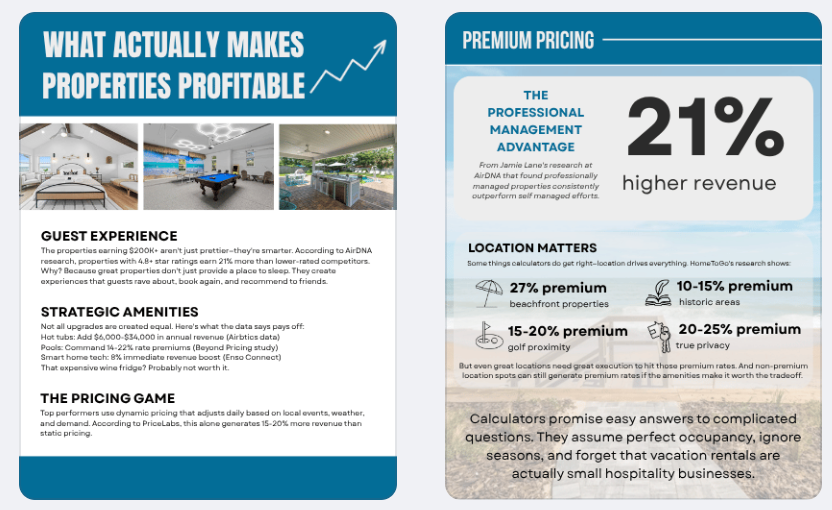
Calculators promise easy answers to complicated questions. They assume:
- Perfect occupancy patterns
- Consistent peak pricing
- Zero operational challenges
- Minimal time investment
- No market competition
Real vacation rental success requires:
- Strategic pricing and revenue management
- Exceptional guest experience delivery
- Professional operations and maintenance
- Continuous market adaptation
- Significant time investment OR professional management
Getting Real Revenue Projections
Instead of relying on calculators, get reality-based projections by:
Analyzing Comparable Properties
- Review actual performance of similar properties in your market
- Understand seasonal variations and demand patterns
- Identify what separates top performers from average properties
Consulting Local Experts
- Professional management companies with market-specific data
- Local real estate professionals who understand vacation rental trends
- Successful property owners willing to share real performance data
Understanding Your Investment
- Calculate all costs including hidden expenses
- Set realistic occupancy expectations based on local data
- Plan for operational time investment or professional management costs
- Factor in market competition and differentiation requirements